Graphs for an Object in Mechanical Equilibrium
Now that we have seen the Net Force Versus Time graph for the person pushing on the refrigerator while it remains at rest. Now, let's look at the Velocity Versus Time graph for the same situation. Click on the green plus-sign button to the right of the word "Velocity" towards the bottom of the simulation page. See the image below and to the left. Click on it to enlarge. The Velocity Versus Time graph will appear below the Net Force Versus Time Graph. See the image below and to the right. Click on it to enlarge.

Click on the green plus-sign button to the right of the word "Velocity" towards the bottom of the simulation window.
|
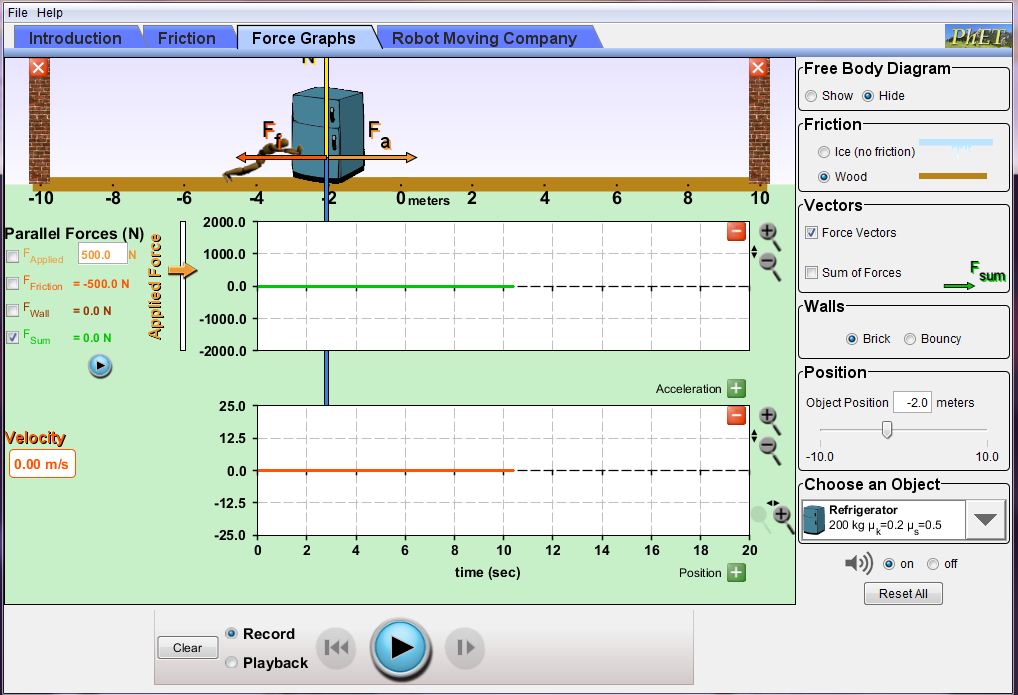
After you click on the green plus-sign button to the right of the word "Velocity," the Velocity Versus Time graph will appear in red below the Net Force Versus Time graph.
|
So, the Velocity Versus Time graph for the refrigerator is still a horizontal line located on the horizontal axis. This shouldn't be too surprising: the refrigerator is not moving, and so it has a velocity of zero.
