Graphs for an Object in Mechanical Equilibrium
Input 500 into the applied force text box. Then hit the "Enter" button on your computer's keyboard. See the image below.
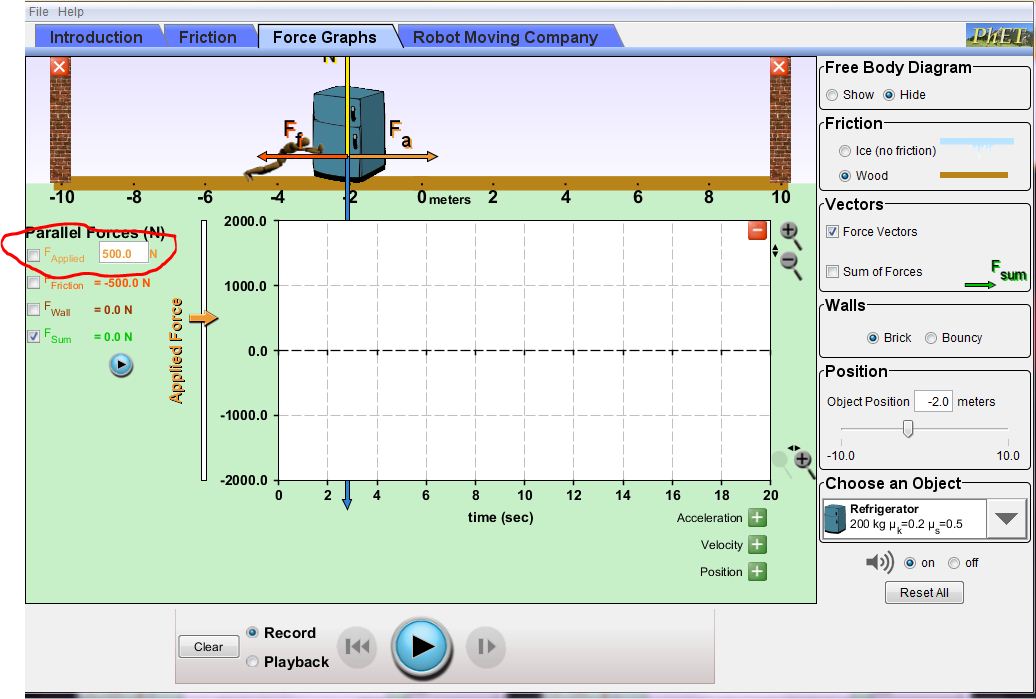
Input 500 into the applied force text box, and then hit the "Enter" button on your keyboard.
Click on the "Play" button at the bottom of the simulation window. See the image below. The "Play" button will be replaced by a "Pause" button. After letting the simulation play for ten seconds, click on the "Pause" button.
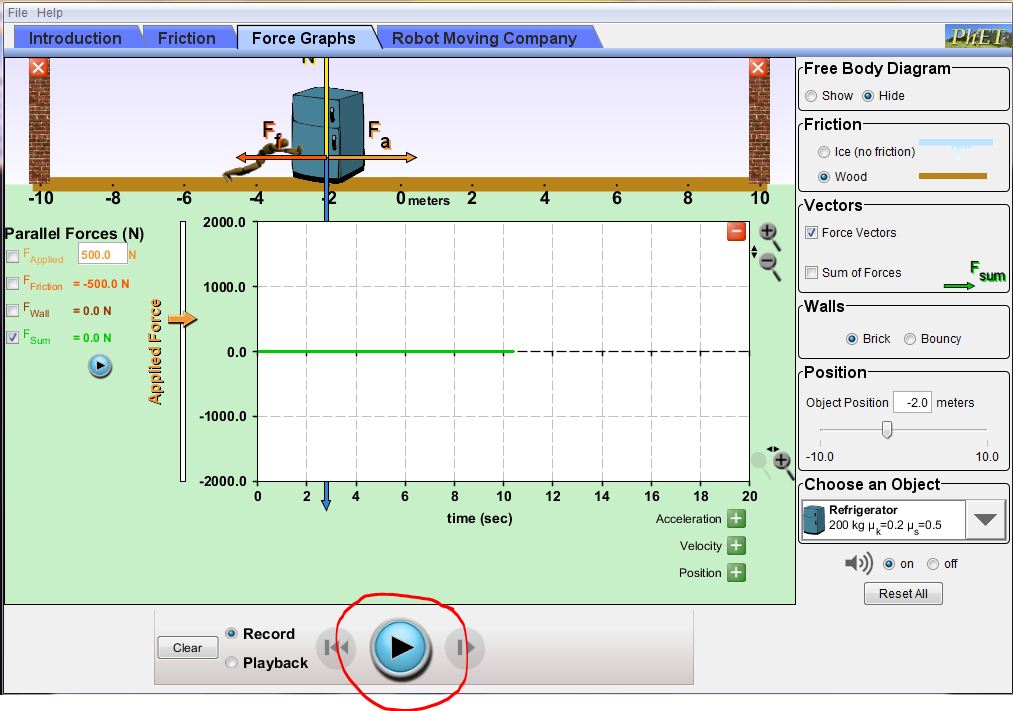
Click on the "Play" button, let the simulation run for ten seconds, and then click on the "Pause" button.
The green line which appeared on the graph when the simulation was playing was the Net Force Versus Time graph for a person pushing on a refrigerator. The refrigerator did not move because static friction was pushing back on the refrigerator as hard as the person was pushing. The net force acting on the refrigerator was then equal to zero Newtons. Thus, the Net Force Versus Time graph for the refrigerator is a horizontal line which is located on the horizontal axis.
