Impulse Calculations With Graphs
|
If we draw a vertical line which connects the right-hand side of the Force Versus Time graph with the horizontal (time) axis, then the graph, the vertical line, and the axes together form a rectangle. See the image at the right. The length of each vertical side of the rectangle represents the force exerted by the club on the ball, and the length of each horizontal side of the rectangle represents the time over which the force acts. We know that if we want to find the area of a rectangle, we multiply the length of the rectangle by its width. Let's say that the length of our rectangle is vertical and its width is horizontal. Then, the area of our rectangle is just the length of one of its vertical sides multiplied by the length of one of its horizontal sides. In addition, the length of each vertical side represents the force by the club on the ball, and the length of each horizontal side represents the time over which the force acts. Thus, the area of our rectangle is equal to the force by the club on the ball multiplied by the time over which the force acts. |

If we draw a vertical line from the right edge of the graph down to the horizontal axis, we will form a rectangle with the axes as two sides.
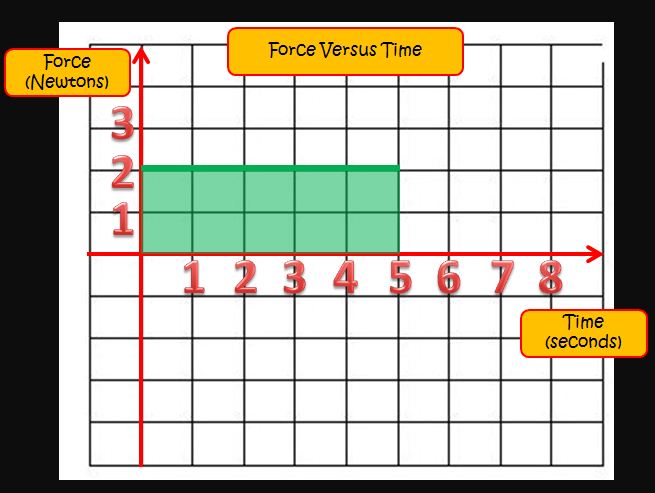
The area of the rectangle above is equal to the force exerted on the ball by the club multiplied by the time over which the force acts.
|
What Does the Area Under the Force Versus Time Graph Represent? Self-Quiz
Scroll to the top of the page and read the material if you have not already. When you are ready to complete the exercise, fill in all the blanks. Then, press "Check" to check your answers. Use the "Hint" button to get a free letter if an answer is giving you trouble. You can also click on the "[?]" button to get a clue. Note that you will lose points if you ask for hints or clues!
