Motion Lab Activity
Page 8 of 19
So, when I moved the man from 0 meters to 6 meters at a slow, steady pace, my Position Versus Time graph looked like the image shown below. Yours should look the same.
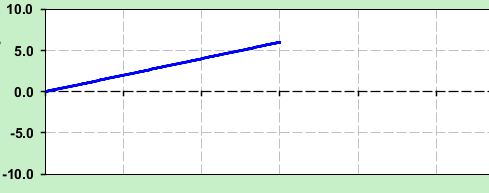
Ms. Clanton's Position Versus Time graph for the man moving from 0 meters to 6 meters at a slow, constant, positive velocity.
|
The Position Versus Time graph we produced for the man is a straight line. Because the graph is a straight line, we can identify some of its components. For instance, we can identify the y-intercept of the graph. In case you do not remember from your college algebra class, the y-intercepts of a graph are any locations where the graph either touches the y-axis or crosses the y-axis. Because our graph is a non-vertical straight line, it has a single y-intercept at y = 0 meters. Note: The unit (meters) for the y-axis of the Position Versus Time graph is indicated on the left-hand side of the graph. See the image at the right. You can enlarge the image by clicking on it.
|
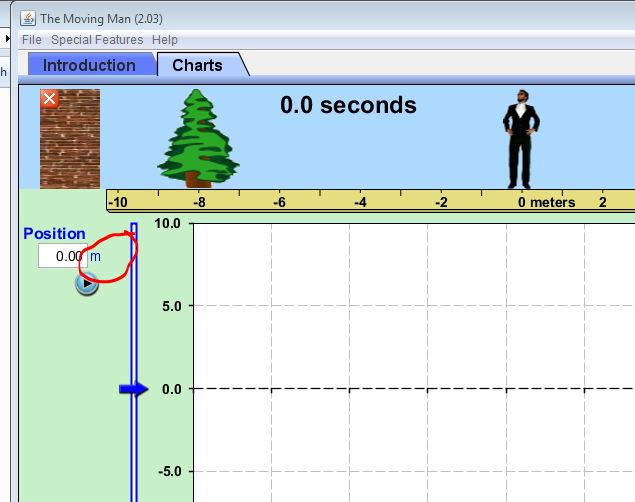
The unit(s) for the vertical axes of "The Moving Man" graphs are indicated to the left of each graph.
|
Again, we have identified the y-intercept of the Position Versus Time graph to be y = 0 meters, but this is only the y-value of the y-intercept. What is the x-value for the y-intercept? Unscramble the two sentences in the self-quiz below to find out.
What is the X-Value for the Y-Intercept? Self-Quiz
Mixed-up sentence exercise
Put the parts in order to form a sentence. When you think your answer is correct, click on "Check" to check your answer. If you get stuck, click on "Hint" to find out the next correct part.
