Motion Lab Activity
Page 7 of 19
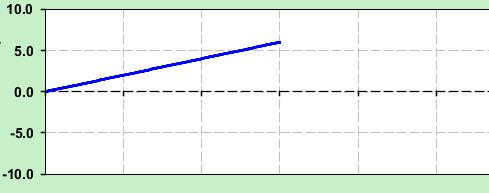
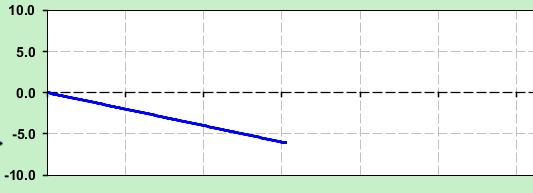
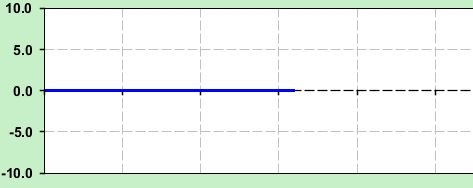
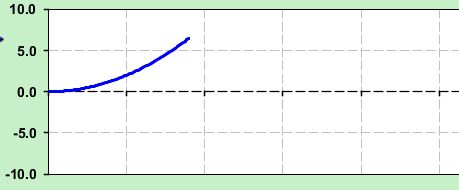
Now, look at the Position Versus Time graph which was created when the man moved at a slow, constant velocity in the positive direction. Choose the graph in the self-quiz below which looks the most like the graph which was created when you moved the man.
Slow, Constant, Positive Velocity Graph Self-Quiz![Scroll to the Top of the Page and Read First Scroll to the Top of the Page and Read First](http://msclantonsphysicalsciencepage.weebly.com/uploads/6/4/7/0/6470542/2508416.jpg?341)
- Choose the image below which looks the MOST like the graph which was produced by the simulation when you slowly and steadily moved the man in the positive direction.
-