Motion Lab Activity
Page 3 of 19
After you download and open "The Moving Man" simulation, you should see the simulation home screen which looks like the image below.

"The Moving Man" simulation home screen.
When in "The Moving Man" simulation home screen, click on the "Charts" tab in the upper left-hand corner of the screen. See the image below. When the "Charts" page opens, you will see the moving man at the top of the screen with three graphs below him. The first graph is the man's Position Versus Time graph, the middle graph is his Velocity Versus Time graph, and the bottom graph is his Acceleration Versus Time graph.

"The Moving Man" Chart Screen
We are only interested in the top two graphs, and so you can eliminate the Acceleration Versus Time graph by clicking on the red minus sign in the upper right-hand corner of the Acceleration Versus Time graph. See the image below.
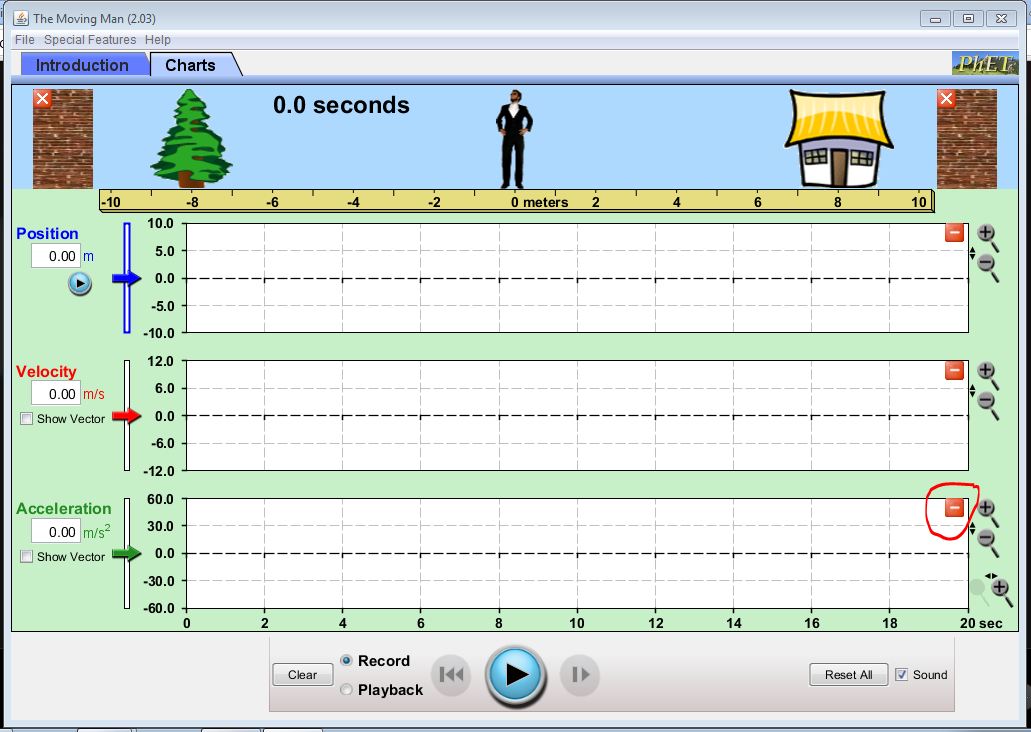
Click the red minus sign in the upper right-hand corner of the Acceleration Versus Time graph to eliminate it.
