Velocity Versus Time Graphs
The Velocity Versus Time graph for a stationary object is a horizontal line located on the horizontal axis (x-axis).
The Velocity Versus Time graph for an object moving at a constant velocity is a horizontal line.
If the Velocity Versus Time graph is located above the x-axis, the velocity is positive; if the Velocity Versus Time graph is located below the x-axis, the velocity is negative.
The farther the Velocity Versus Time graph is away from the x-axis, the larger the magnitude (size) of the velocity. In other words, the faster the object is going.
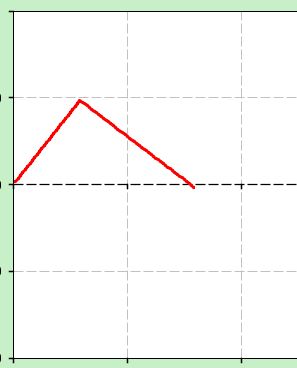
The Velocity Versus Time graph for an object which is accelerating is a non-horizontal straight line, and slope of the line is the acceleration of the object. If the slope of the Velocity Versus Time graph is positive, the object represented by the graph has a positive acceleration. If the slope of the Velocity Versus Time graph is negative, the object has a negative acceleration.
The area between an object's Velocity Versus Time graph and the x-axis is the displacement of the object.
The Velocity Versus Time graph for an object moving at a constant velocity is a horizontal line.
If the Velocity Versus Time graph is located above the x-axis, the velocity is positive; if the Velocity Versus Time graph is located below the x-axis, the velocity is negative.
The farther the Velocity Versus Time graph is away from the x-axis, the larger the magnitude (size) of the velocity. In other words, the faster the object is going.
The Velocity Versus Time graph for an object which is accelerating is a non-horizontal straight line, and slope of the line is the acceleration of the object. If the slope of the Velocity Versus Time graph is positive, the object represented by the graph has a positive acceleration. If the slope of the Velocity Versus Time graph is negative, the object has a negative acceleration.
The area between an object's Velocity Versus Time graph and the x-axis is the displacement of the object.
Example
If the graph below is the Velocity Versus Time graph for blood in the descending aorta during one heartbeat, what is represented by the area between the graph and the x-axis? See the shaded area in the image at the right.
|

|
Answer
The area under a Velocity Versus Time graph is the displacement of the object represented by the graph. Thus, the area under this Velocity Versus Time graph is the displacement of the blood in the descending aorta during one heartbeat.
